
Key takeaways
- 01
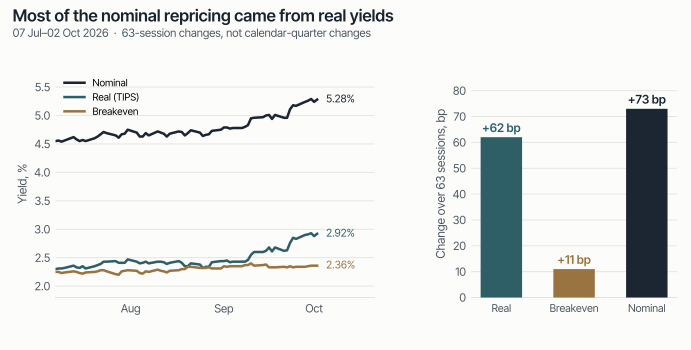
Higher yields are mostly real: 62 bp of the latest 73 bp rise in 10-year yields.
- 02
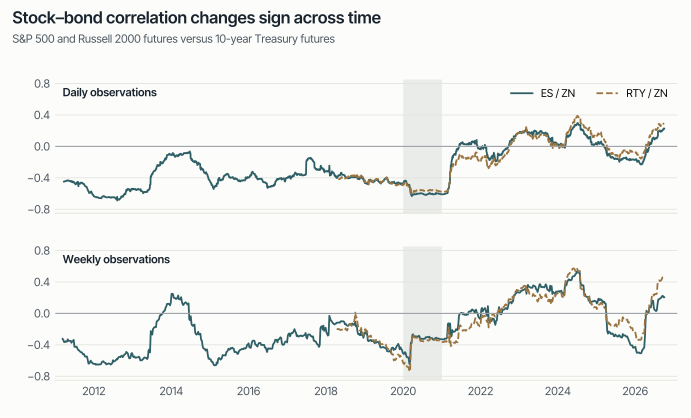
The stock–bond offset weakened: daily correlation −0.44 → +0.07; latest rolling +0.22.
- 03
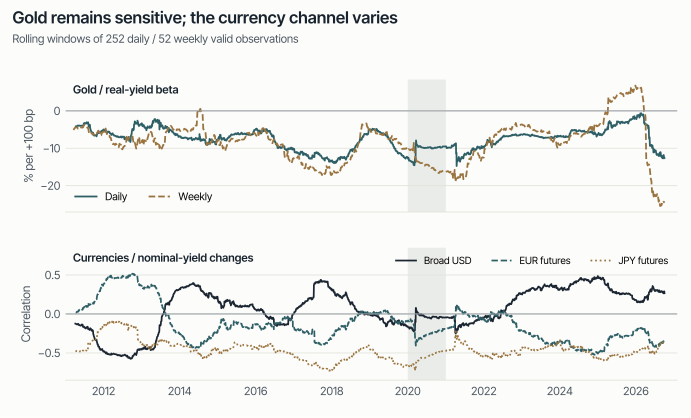
Gold still reacts to real yields: daily sensitivity around −7% per +100 bp in both periods.
- 04
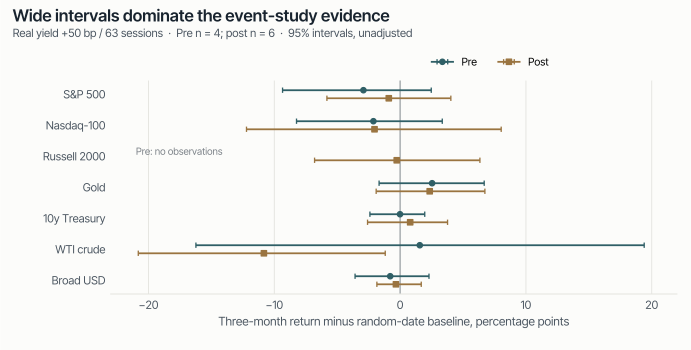
Yield shocks give no clear equity signal: just 4 / 6 completed pre-/post-COVID episodes.
- 05
Closer historical matches disappear: zero completed episodes fit the full current-state filter.
Higher real yields, not just higher inflation pricing.
On 2 October 2026, the US 10-year Treasury yield was 5.28% and the 10-year TIPS real yield 2.92%. A year earlier, on 2 October 2025, they were 4.10% / 1.76%: rises of 118 / 116 bp. The broad dollar rose only 0.8% over that same year.
 Enlarge chart
Over those 63 sessions, the 10-year yield rose 73 bp (62 bp real + 11 bp breakeven); the 10y–2y curve steepened 9 bp. This is a modest bear steepener: yields rose, with longer yields rising more. Growth, policy, risk premia and liquidity can all contribute; the split does not identify the cause. This note is descriptive, not investment advice.
A weaker stock–bond offset, not a permanent law.
Before COVID, the daily correlation between S&P 500 futures (ES) and 10-year Treasury futures (ZN) was −0.44. In the main post sample, starting January 2021, it was +0.07. Weekly observations tell a similar story: −0.39 to +0.11. A hedge relationship that once worked on average became much less dependable in this sample.
 Enlarge chart
The sample boundary matters. Starting the post period in March 2020 rather than January 2021 lowers the daily ES–ZN correlation to −0.08. The acute pandemic shock and subsequent recovery alter the average. “After COVID” is therefore a period definition, not a structural parameter.
The latest rolling daily ES–ZN correlation is approximately +0.22; the weekly RTY–ZN estimate is approximately +0.45. Yet stock–bond correlations were negative again during parts of 2025 and early 2026. Neither the pre-COVID average nor today’s sign should be treated as permanent.
Equities also changed their contemporaneous association with real yields. ES’s daily beta moved from +5.28% to −3.52% per +100 bp; Nasdaq-100 futures moved from +5.14% to −4.66%. These regression slopes summarise joint movements. They do not mean a future 100 bp rise would mechanically generate the quoted return.
Price trends and return sensitivities can diverge.
Gold can rise over a long period in which real yields also rise, yet still respond negatively to short-horizon real-yield changes. The daily gold-futures beta was −7.14% before COVID and −6.83% afterwards per +100 bp. Controlling for broad-dollar returns leaves it negative, at −6.73% and −5.09% respectively.
 Enlarge chart
The latest rolling gold beta is approximately −12.6% on daily observations and −24.6% on weekly observations, following a period when the weekly beta turned positive. That time variation argues against treating either “gold ignores real yields” or a single constant beta as a general rule.
The broad dollar’s daily correlation with US nominal-yield changes moved from −0.09 to +0.26. EUR futures shifted from +0.02 to −0.28; JPY futures were already negative, at −0.42 to −0.46. US yields alone are not a complete currency model: relative international yields and risk sentiment also matter. A stronger short-run correlation does not require a persistent annual dollar rise.
Crude oil shows why nominal and real yields should not be conflated. WTI futures’ nominal-yield correlation remained positive (+0.27 to +0.18), while its real-yield correlation fell from +0.07 to approximately zero. Nominal repricing can combine growth, inflation and discount-rate information; the data do not isolate their causal effects.
Small samples, no direction signal.
After real yields rose at least 50 bp in 63 sessions, three-month S&P 500 futures returns were 2.92 / 0.90 percentage points below their pre-/post-COVID random-date baselines. Both 95% intervals include zero; there are only four / six completed episodes.
 Enlarge chart
Oil caveat: post-COVID WTI’s −10.8 pp excess return has an interval below zero, but it is one unadjusted result among many tests, not a validated signal.
The closer the match, the thinner the evidence. Requiring a real-led steepener with stable breakevens leaves three completed episodes per regime; adding calm equity volatility together with elevated rates and commodity volatility leaves none. No analogue means no completed match under these rules—not safety, a crash warning or no relevant history.
Methodology
- Periods and returns. Before COVID: 7 June 2010 to 31 December 2019. After COVID: 1 January 2021 to 2 October 2026. 2020 is excluded from both periods; a sensitivity check starts the second period on 1 March 2020 instead. Correlations and betas use daily log returns and daily yield changes, not levels; weekly figures sum at least three valid daily observations. Betas are percentage returns per +100 bp. Rolling windows use about one year of valid pairs (252 daily or 52 weekly, minimum 200 / 40). Yield and futures closes are not exactly synchronised.
- Futures. Daily prices come from the most-traded contract. Returns that span a contract change, non-positive prices and gaps of more than five calendar days are removed, so roll days are excluded. Forward returns compound the retained observations and omit roll-day mark-to-market, cash interest, trading costs and dividends: they approximate price movements and are not investable total returns. Drawdowns may be understated. No Tensor portfolio performance is shown.
- Yield-shock episodes. An episode starts at the first +50 bp rise in the 10-year real yield over 63 sessions, with at least 126 sessions before the next one. Outcomes are measured 21, 63 and 126 sessions later and cut off at period boundaries and the sample end. They are compared with random start dates in the same period; the 95% intervals combine a bootstrap over episodes with a block bootstrap of the baseline. Exact three-month results: ES means +0.17% / +1.90% against random-date means +3.09% / +2.81%, excess intervals [−9.34, +2.47] / [−5.82, +4.03] pp (before / after COVID). WTI after COVID: mean −5.8%, excess −10.8 pp, interval [−20.8, −1.2] pp. Completed episodes: four before, six after (seven at the one-month horizon). Samples this small, overlapping windows and the absence of any multiple-testing correction or holdout validation make the intervals indicative only. Missing outcomes are not zero.
- Current-state filter. Real yield +50 bp over 63 sessions; nominal yield rising; real yield rising at least as much as breakeven; 10y–2y curve steepening; breakeven change within ±15 bp; calm implied equity volatility; ES realised volatility in the lower 40% of its history; ZN and median commodity (gold, WTI, gasoline, corn) realised volatility in the upper 40%. Realised volatility uses ten-day windows ranked against up to five years of prior observations. The first full match after COVID is 25 September 2026, without completed outcomes.
- Seasonality. S&P 500 daily closes from 1949 to 2 October 2026; price returns without dividends; observations before 1957 use predecessor-index history. Midterm years are 1950, 1954, …, 2022 (19 completed). Start is the first close on or after 6 October; the 12-month end is the first close on or after 6 October of the following year; year-end is the last close of the calendar year. Only outcomes completed by 2 October 2026 count (other years: 57 to year-end, 56 at 12 months). “Near a high” means within 5% of the preceding calendar year’s maximum close (nine years: 1950, 1954, 1958, 1978, 1982, 2006, 2010, 2014, 2018). Intervals come from 50,000 year-level bootstrap resamples, not adjusted for multiple selection choices or dependence across years. 2018: October anchor 8 October; full fourth quarter 28 September to 31 December; 10-year Treasury yield 3.05% at end-September, 3.15% at end-October, 2.69% at year-end.
- Interpretation. RTY history begins 10 July 2017, so it has no pre-COVID shock outcomes. Yield data are an archived current vintage, not a real-time reconstruction. TIPS yields include liquidity and risk premia; breakevens are not pure inflation expectations. All results are descriptive associations under stated thresholds and dates, not causal estimates or forecasts.
Source: Tensor internal research.