
Key takeaways
- 01
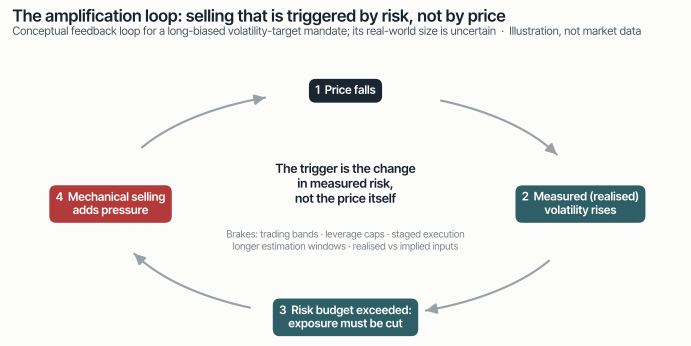
A lower price need not attract a buyer. A binding volatility target can require a long-biased portfolio to cut exposure after a sell-off.
- 02
The mechanism is clearer than the aggregate flow. Risk estimates, leverage, correlations and execution rules differ; a VIX print is not a universal sell instruction.
- 03
Similar headlines can conceal different mechanisms. Volatility-product rebalancing, portfolio deleveraging and option-market liquidity should not be treated as interchangeable explanations.
A moving risk budget, not a fixed notional.
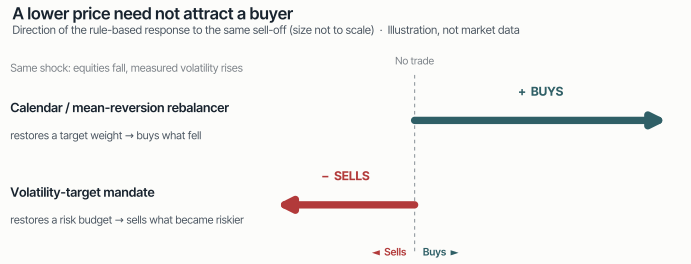
Note 03 asked who is forced to trade, and when. A calendar rebalancer may buy equities after they fall. A volatility-targeting mandate may do the opposite: if measured risk rises, it must reduce exposure to restore its risk budget. Here the trigger is risk, not month-end. “Forced” means required by the strategy’s rules, not necessarily compelled by a margin call.
 Enlarge chart
The simplest rule is:
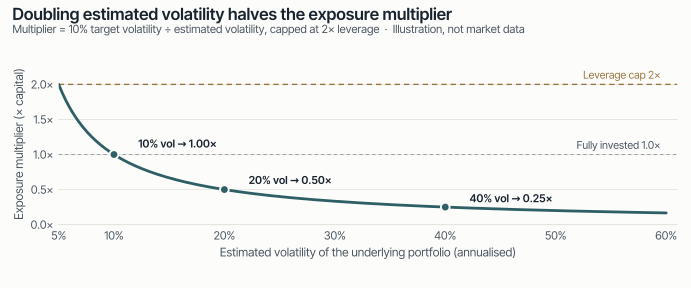
Exposure multiplier = target volatility ÷ estimated volatility of the underlying portfolio.
This is a simplified scaling rule before leverage caps, trading bands and implementation lags. Doubling estimated volatility halves the multiplier, holding everything else fixed — arithmetic, not an observed flow estimate. The objective is stable risk rather than stable notional exposure (Man Group, “The Impact of Volatility Targeting”).
 Enlarge chart
Which volatility matters? Realised-volatility estimates look backwards. The ECB’s published risk-parity example uses a one-month rolling window and daily rebalancing; this is one specification, not an industry standard (ECB Financial Stability Review, May 2020). Shorter windows generally respond faster; longer windows retain the shock for longer. An implied-volatility spike affects a rule directly only if its risk estimator uses that input. A realised-volatility rule does not automatically trade because VIX rises.
Risk parity adds another dimension: allocating risk across assets is not the same as targeting the portfolio’s total volatility. Where both are used, rising cross-asset correlations can remove diversification and trigger deleveraging even without a fresh equity decline (ECB, May 2020). Reducing a long position means selling; reducing a short means buying. “All systematic funds must sell” is therefore wrong.
 Enlarge chart
No verified census, only dated snapshots.
There is no verified, current public census in the sources reviewed. In May 2020, the ECB cited approximately $300 billion across some 100 risk-parity funds (ECB Financial Stability Review, May 2020). This verifies what the ECB published, not an audited industry total or today’s AUM.
The broader volatility-control universe also includes mandates and overlays outside standalone risk-parity funds. Available estimates use different boundaries. They should not be added together without checking overlap, dates and whether the figures represent capital or leveraged exposure. Recent secondary estimates are therefore not combined into a single total here.
AUM alone does not determine market impact. Starting exposure, the required adjustment, execution speed and available liquidity all matter.
Similar headlines, different mechanisms.
February 2018: a concentrated rebalancing feedback loop
On 5 February 2018, the S&P 500 fell 4.2% for the day as a whole and VIX jumped 20 points, according to the BIS. Selected leveraged and inverse volatility ETPs held about $4 billion at end-2017 (BIS Quarterly Review, March 2018).
Both leveraged-long and inverse products needed to buy VIX futures as volatility rose. Their daily exposure resets created reinforcing demand; the BIS also describes transmission into equity futures through dealer hedging. This is evidence of mechanical amplification, but these products were not conventional equity volatility-control funds. Their asset base is not a measure of the wider vol-targeting industry.
March 2020: correlations joined the shock
The ECB’s stylised risk-parity portfolio targeted 8% annualised volatility. As volatility and correlations rose, its model required sales worth nearly 225% of portfolio capital, leaving nearly 25% in cash (ECB Financial Stability Review, May 2020). Sales can exceed capital when a portfolio starts leveraged.
These are model-implied adjustments, not observed industry sales. The example shows why deleveraging can include bonds as well as equities. The ECB explicitly says the strategies’ actual contribution to the downturn remains uncertain: initial leverage, holdings and calibration were insufficiently known. A persuasive mechanism is not a causal attribution of the crash.
August 2024: do not read VIX as a flow meter
On 5 August 2024, VIX rose 180% to almost 66 before the US market opened, then finished around 39 (BIS Bulletin 95, October 2024). These are published event observations, not a reproduced market-data series.
The BIS linked the broader turbulence to leveraged equity and currency unwinds, including FX carry trades (BIS Bulletin 90, 2024). Its separate VIX analysis found that widening option bid–ask spreads helped inflate the index; VIX ETFs and dispersion unwinds were unlikely to be the main drivers of that spike (BIS Bulletin 95). The yen-carry unwind, portfolio risk reduction and the VIX calculation are related context — not the same trade.
Ask about the trigger, not just the leverage.
Know the trigger. Establish whether a manager uses realised volatility, implied volatility, correlations or a combination, and how quickly exposure can change.
Stress the portfolio, not just equities. A risk budget can tighten when diversification fails. Examine collateral and liquidity requirements alongside headline leverage.
Distinguish target exposure from executable orders. Bands, caps and staged execution can change the timing and size of the market-facing flow. “Price-insensitive” describes the risk rule’s indifference to valuation, not an obligation to execute immediately at any price.
Do not confuse amplification with inevitability. Volatility targeting also has a legitimate risk-management purpose. Man Group’s research finds historical reductions in tail risk across its studied assets; that is not a guarantee for every implementation (Man Group, “The Impact of Volatility Targeting”).
Method and limits
- What is robust: inverse-volatility scaling reduces exposure when its risk estimate rises, subject to the actual rules. Shared constraints can amplify selling in stressed markets.
- What remains uncertain: the current aggregate capital base, live positions, execution schedules and the fraction of any sell-off attributable to these strategies. This note contains no Tensor flow forecast, trading signal or portfolio performance. It does not claim that Tensor predicts these episodes.
- Sources: the figures quoted in the text come from published documents: BIS Quarterly Review (March 2018); ECB Financial Stability Review (May 2020); BIS Bulletins 90 and 95 (2024); Man Group, “The Impact of Volatility Targeting”. No licensed time series or third-party charts are reproduced; all figures are illustrations without market data.
Source: Tensor internal research.