
Correlation changes with the regime.
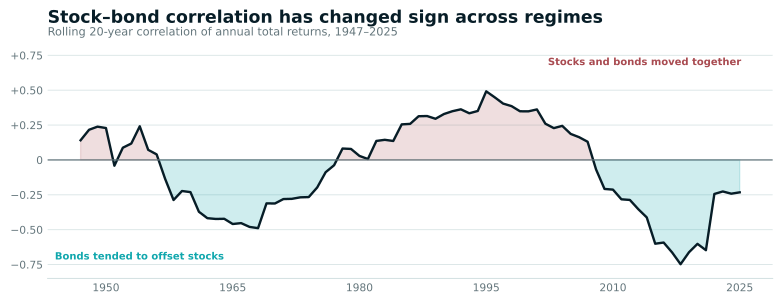
Long-run evidence shows that stock–bond correlation has moved between positive and negative regimes. A negative estimate from one period is therefore not a contractual hedge for the next drawdown.
 Enlarge chart
Growth shock
Disinflation and policy easing can support duration while equities weaken—allowing the traditional offset to work.
Inflation shock
Higher inflation, policy rates or term premia can pressure equities and nominal bonds at the same time.
- RegimesStock–bond correlation is time-varying and has changed sign across long samples.
- DirectionalitySystematic trend strategies can change direction, but only after a trend becomes observable.
- ComplementarityResilience comes from different return mechanisms—not more labels for the same macro exposure.
Different shocks. Different outcomes.
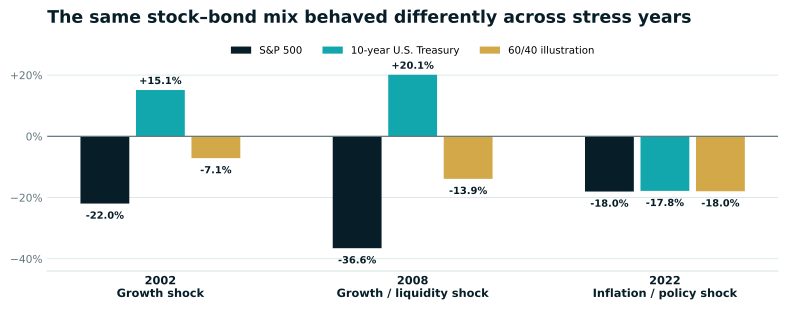
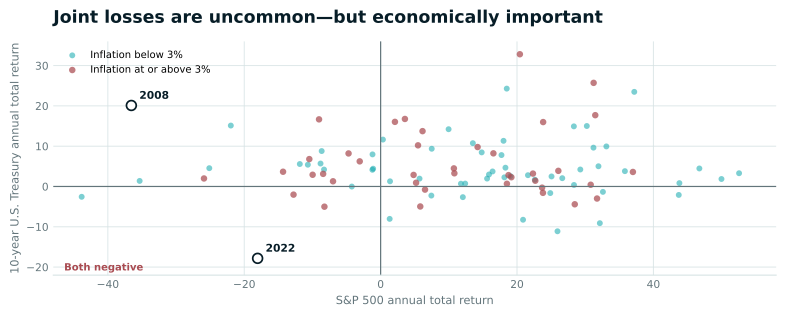
The contrast between 2008 and 2022 is the central visual lesson: duration provided a powerful offset during a growth and liquidity shock, but not during an inflation and policy shock.
 Enlarge chart
 Enlarge chart
Data: Aswath Damodaran, Historical Returns on Stocks, Bonds and Bills, 1928–2025. The S&P 500 series includes dividends; Treasury returns use a constant-maturity 10-year repricing methodology based on FRED yields. Tensor calculations. Historical results are not predictive.
Trend following is not a static hedge.
A generic time-series momentum implementation can hold long exposure after positive trends and short exposure after negative trends across equity indices, rates, currencies and commodities. That directional flexibility can create a return path unlike long-only assets when moves persist.
Why the mechanism can diversify
- Direction can change as price trends change.
- Risk can be distributed across multiple asset classes.
- Persistent macro repricing can create time for adaptation.
Why the mechanism can disappoint
- A sudden shock can occur before the signal turns.
- Sharp reversals can create whipsaw losses.
- Trading costs, contract rolls and implementation matter materially.
Historical research: evidence and limitations
liquid futures
Studied across equity index, currency, commodity and bond futures by Moskowitz, Ooi & Pedersen.
month persistence
Intermediate-horizon return persistence reported in the study.
historical start
Hurst, Ooi & Pedersen extend trend-following evidence across global markets to 1880.
largest 60/40 crises
Their constructed strategy was positive in eight of ten largest crisis periods studied.
Interpretation discipline. “Eight out of ten” is historical evidence from a constructed research strategy—not a promise that any CTA, implementation or future crisis will be profitable.
Test the sources of diversification.
Two engines should be combined because their economic behaviour is expected to differ—not because two backtests make a chart look smoother. The test is whether complementarity survives costs, common-factor decomposition, crisis analysis and out-of-sample evaluation.
Stress multiple regimes
Use rolling and crisis-window correlations rather than one full-sample covariance matrix.
Test common exposures
Measure equity, duration, USD, commodity, volatility and momentum dependence.
Preserve the path
Stress gaps, persistent trends, policy reversals and liquidity assumptions—not only end-point returns.
Model implementation drag
Include turnover, bid–ask, slippage, financing, rolls and stressed costs.
Publish failure modes
Show where each engine loses, where both lose together and how quickly diversification can disappear.
Keep evidence auditable
Document data lineage, regime definitions, holdout choices and human approval.
The objective is not permanent protection. It is fewer ways for one regime to dominate the entire portfolio.Discuss our research architectureExplore the strategy concepts